Using Deep Learning and satellite imagery to detect Urban Heat Island (UHI) effects
Final project for the Data Science Bootcamp at SPICED Academy. By Jan Kühn, June 2023
The Urban Heat Island (UHI) effect is a significant environmental issue that refers to the increased temperature in urban areas compared to their rural surroundings. This phenomenon is primarily caused by human activities, changes in land use, and built infrastructure. Dark surfaces, such as certain roofing materials, are known to absorb more solar radiation and contribute to elevated temperatures.
The UHI effect exacerbates the impacts of climate change, leading to increased energy consumption, impaired air quality, and adverse health effects such as heat-related illnesses and mortality.
As heat waves are likely to become more frequent, preventing and mitigating the UHI effect is crucial for sustainable urban development and climate change adaptation.
Goal of the project
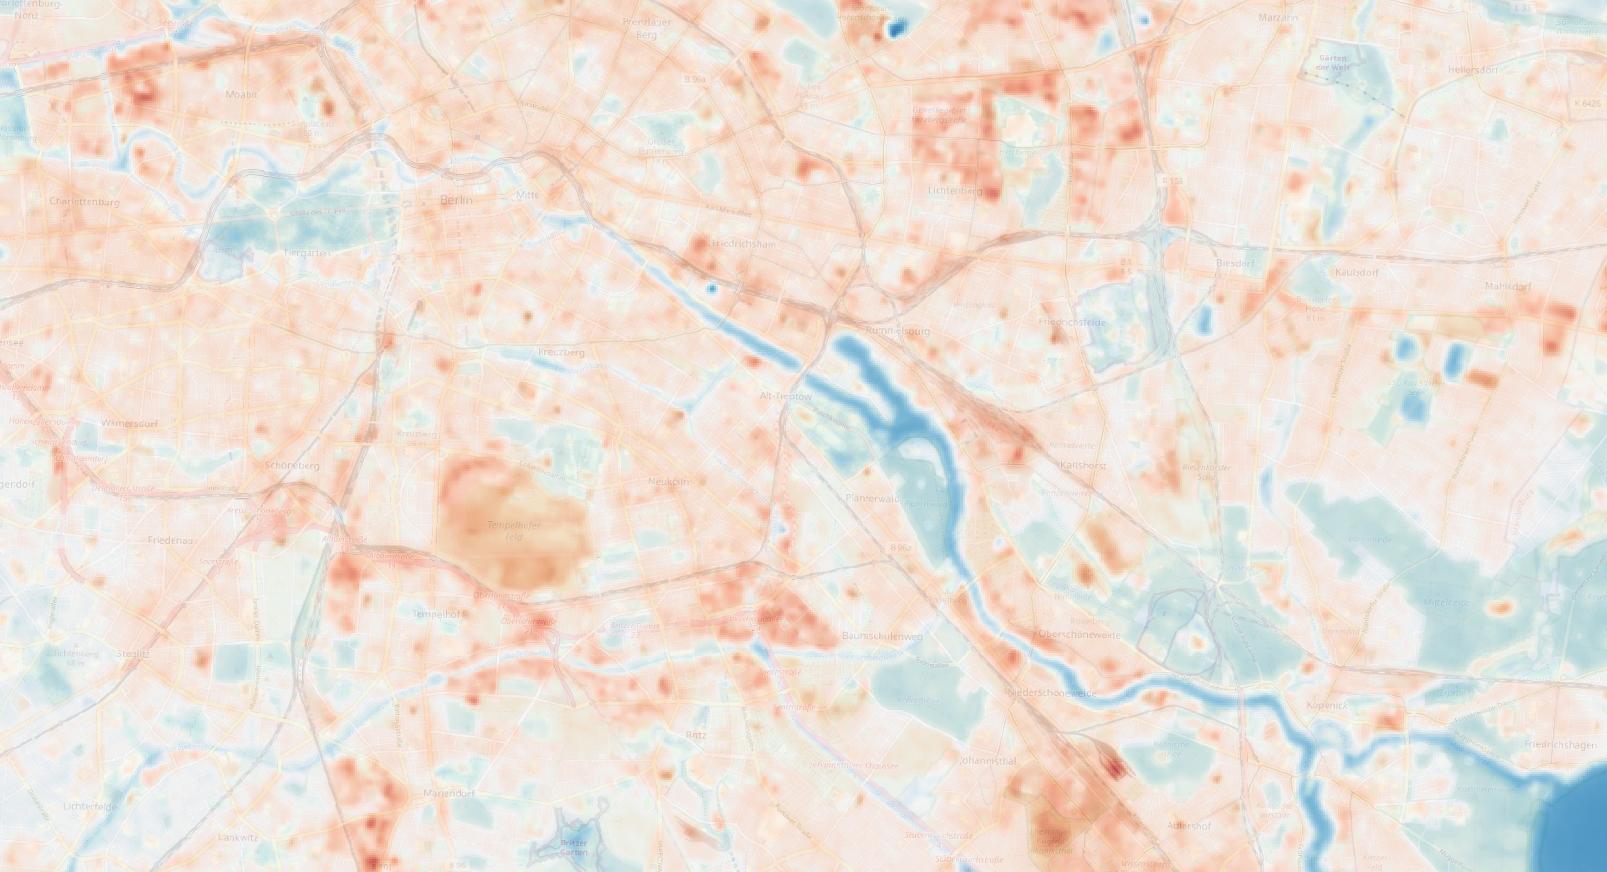
The goal of the project was to use satellite imagery – including infrared bands – to detect and visualize UHI effects in urban areas.
To accomplish that, the plan was to build and train a Deep Learning model to segment building roofs in urban areas from high-resolution satellite imagery.
With that data, we could identify spots for public interventions like green roofs, change of roof material/color, or installation of solar panels.
What I did
- I used pre-trained Unet segmentation model with transfer learning to recognize building footprint on satellite imagery.
- The model is based on a resnet-34 / resnet-50 backbone (both are included) and imagenet weights.
- It is a Convolutional Neural Network (CNN) with 34 / 50 Layers.
- Being a Unet model means that it has an encoding part and a decoding part (to reconstruct the image).
- The dataset I used for training is called Landcover.ai.
- It is publicly available on kaggle.com and consists of 40 high resolution labeled images.
- I broke those images down to about 40.000 patches of 256x256px size.
- From those, I selected 2.000 patches with relevant information for training (because most is woodland, which is not of use in this case).
- The metric I used was Mean IoU (Intersection over Union). It is a number from 0-1 which specifies amount of overlap between prediction & ground truth. 0 means no overlap, 1 means complete overlap (100%).
- The best score I reached on unseen test data: 0.86 (equivalent to 86% of correctly classified pixels).
- Additionally, I wrote Python scripts to process Landsat 8 satellite imagery and create geospatial images for the following metrics:
- Normalized Difference Vegetation Index (NDVI): Calculated from Landsat 8 bands 4 (visible red) and 5 (near-infrared)
- Emissivity: Calculated from Landsat 8 bands 4 (visible red) and 5 (near-infrared)
- Land Surface Temperature (LST): Calculated from Landsat 8 bands 4 (visible red), 5 (near-infrared), and 10 (long wavelength infrared)
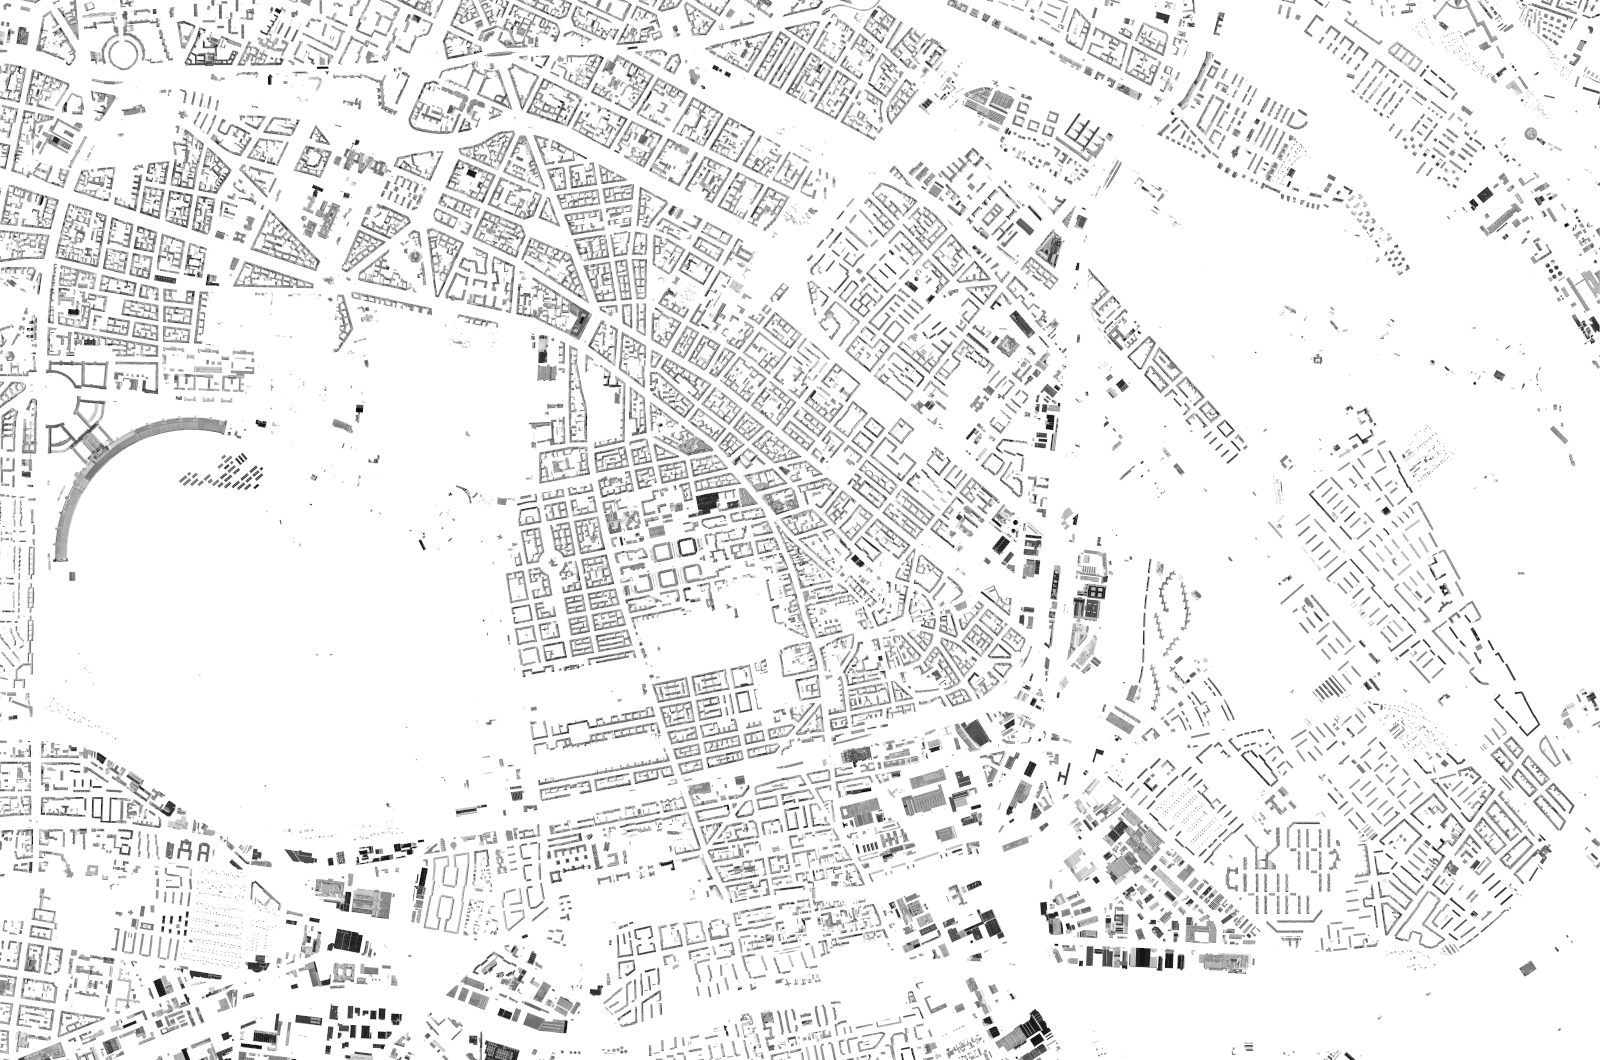
- Building Footprints: From Segmentation using the Deep Learning model and extracted from Openstreetmap data
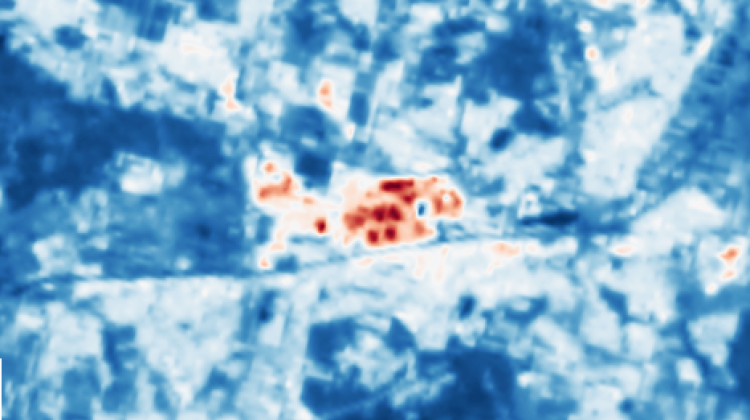
- Luminance of Building Footprints: Calculated from Landsat 8 bands 2 (visible blue), 3 (visible green), and 4 (visible red) using building footprints as masks
Use
The code can be found on GitHub.
You can see results of the project in a Streamlit App which basically contains the live presentation of the final project. In the section "Segment" (Live Segmentation) you can try the segmentation from satellite imagery. Below, you can find a short screencast of the live segmentation.
To run the Streamlit App, set up a Python environment, clone the repository and install the required packages, for example using PIP.
Important: Before running streamlit run app.py, make sure to add SM_FRAMEWORK as an environment variable:
git clone https://github.com/yotkadata/uhi_detector
cd uhi_detector/
pip install -r requirements.txt
export SM_FRAMEWORK=tf.keras
streamlit run app.py
Screencast showing live segmentation of satellite imagery
Screencast of the live segmentation part included in the Streamlit app. From a Folium map, one can select an area which is then extracted. After that, the segmentation model is applied to identify building footprints, roads, trees, and water.
Video file
Screencast showing examples of live segmentation of satellite imagery
Video file